Benchmark
Option 1: Quick benchmark in Google Colab
This is the easiest way to execute the benchmark replication. Nothing needs to be installed, you just need a Gmail account to access Google Colab, which provides GPU resources for free. This benchmark is limited to the comparison of the Python tools (xlogit, pylogit, and biogeme), as Google Colab does not run R code (for apollo and mlogit). However, this quick benchmark demonstrates how fast xlogit is compared to existing tools and resembles to a large extent the tables and figures in the paper. To execute this benchmark, click the link below and select Runtime > Run all to run all the execution cells.
This benchmark should not take longer than one hour of execution. The source code of this quick benchmark can be found in the provided “benchmark” folder or in the “examples/benchmark” folder in the Github repository.
Option 2: Mini benchmark
This is a minimal version of the full benchmark replication that can be executed in less than one hour (or a little longer depending on your computer specs). Executing this benchmark requires some basic knowledge in execution of commands in a Microsoft Windows or Linux command line.
Hint
(OPTIONAL) Docker image available: If you have a Linux machine, the easiest way to run the mini (and full) benchmark is using the Docker image arteagac/xlogit:benchmark in Docker’s Hub. You just need to install Docker and run:
docker run --gpus all arteagac/xlogit:benchmark
After running the benchmkark, the results (including the plots) are saved in the xlogit/examples/benchmark/results folder, which can be extracted using:
docker cp <container_id>:xlogit/examples/benchmark/results .
To identify your container id, you need to run docker ps -a. The Dockerfile used to create the xlogit-benchmark image can be found in the provided benchmark folder.
2.1 Requirements
A CUDA-enabled NVIDIA Graphics Card
Windows 10 or Linux Operating System
Processor at least with 4 Cores (for apollo and biogeme)
2.2 Installation steps
Given that this benchmark compares five different estimation packages, several dependencies need to be installed. However, the following instructions provide all the necessary details for the installation of the dependencies. If you use Microsoft Windows, some steps require running an Anaconda Power Shell prompt, which you should always run as administrator to avoid any permission issues. Additional details are provided below.
Step 1. Setup Python tools
Step 1.1 Install Python
Miniconda provides a convenient toolset to install and work with Python libraries. Download miniconda using the following links:
Windows: https://repo.anaconda.com/miniconda/Miniconda3-py38_4.9.2-Windows-x86_64.exe
Linux: https://repo.anaconda.com/miniconda/Miniconda3-py38_4.9.2-Linux-x86_64.sh
After installing miniconda, open a command line in Linux or the Anaconda Powershell Prompt in Windows (Start Menu > Anaconda > Anaconda Powershell Prompt) and verify that the conda command is available by executing the following command:
conda --version
Step 1.2 Setup a conda Python environment
Create and activate a conda environment (Python 3.8) for the benchmark by executing the following commands in a command line or the Anaconda Powershell Prompt in Windows:
conda create -n benchmark python=3.8
conda activate benchmark
After running the previous commands, make sure that the python and pip commands are available and they use the correct Python version (3.8) by executing:
python --version
pip --version
Warning
All the commands in the following steps must be executed after activating the benchmark conda environment. Therefore, if you close your command line or Anaconda Powershell Prompt, you need to execute again conda activate benchmark before executing any command.
Step 1.3 Install the CuPy Python Package
CuPy is required to use GPU processing in xlogit. Follow these steps to install CuPy:
Install the CUDA Toolkit v11.0 for your operating system by downloading it from: https://developer.nvidia.com/cuda-11.0-download-archive. This may downgrade your installed NVIDIA driver so you may need to upgrade your driver back after running the benchmark.
Install the CUDA Toolkit in your
benchmarkconda environment by running the following command in the command line or Anaconda Powershell Prompt in Windows:conda install cudatoolkit==11.0.221
Run the following command to update
pipas required by CuPy:python -m pip install -U setuptools pip
Install CuPy for CUDA Toolkit 11.0 by running in the command line or Anaconda Powershell Prompt:
pip install cupy-cuda110
After this, you need to close your command line (or Anaconda Powershell Prompt in windows) and open it again so the changes take effect. Remember that after reopening the command line you need to run again
conda activate benchmark.Verify that CuPy was properly installed by running the following command, which must run without showing any errors:
python -c "import cupy"
Hint
Although these instructions assume that you will use the CUDA Toolkit v11.0 and the associated CuPy version, you can install any other version of the CUDA Toolkit and CuPy that matches best your existing NVIDIA Driver. Check CuPy’s installation instructions in this link for additional information or troubleshooting of CuPy’s installation.
Step 1.4 Install Python packages for benchmark
In this step, xlogit, pylogit, and biogeme are installed. In your command line (or Anaconda Powershell Prompt in windows) navigate to the location of the provided benchmark folder using the cd (change directory) command (e.g. cd C:\User\xlogit\benchmark) and then install the Python requirements using the following commands:
pip install numpy
pip install xlogit==0.1.4
pip install pylogit==0.2.2
pip install biogeme==3.2.6
pip install -r requirements_python.txt
The biogeme Python package sometimes has issues during the initialization so reinstalling it helps avoiding future issues. To reinstall it, use the following commands:
pip uninstall biogeme
pip install biogeme==3.2.6 --no-cache-dir
Step 2. Setup R tools
Step 2.1 Install R v4.0
You must use R version 4.0.3 (and not 3.6) for the benchmark, as the installation of dependencies is easier with this version.
For Windows: Download R v4.0 from https://cran.r-project.org/bin/windows/base/R-4.0.3-win.exe and follow the installation prompts. Make sure that R is available from the Anaconda Powershell Prompt by executing
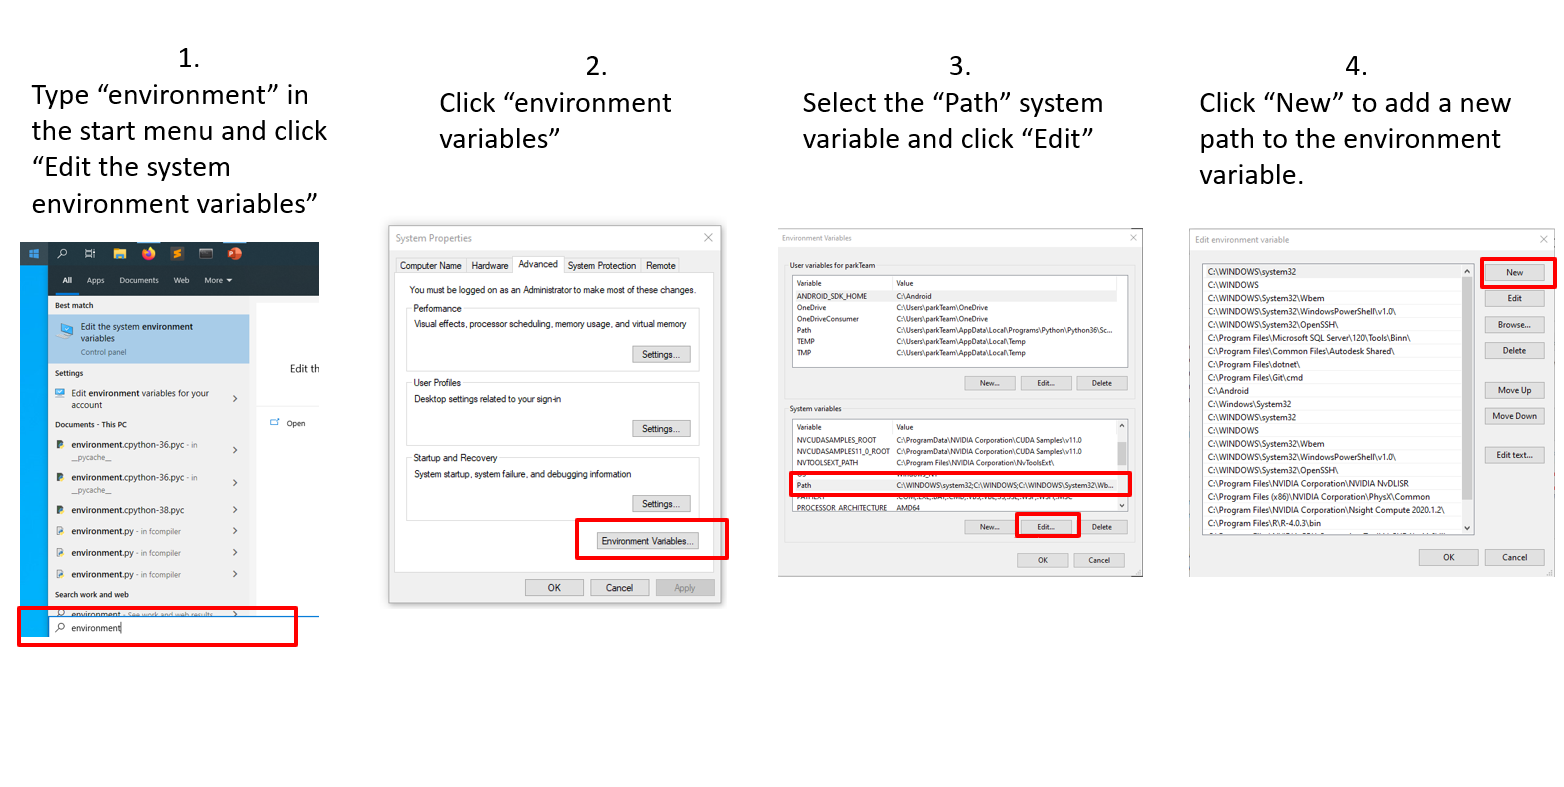
Rscript --version. If this command does not run properly, you need to add R’s installation folder path (including the “bin” folder) to the Path environment variable as shown in the image in this link. For instance, a common R installation folder isC:\Program Files\R\R-4.0.3\bin(note that thebinfolder at the end of the path is required). After adding your R installation folder to the Path environment variable, you need to close your Anaconda Powershell Prompt and open it again in Administrator mode (Right click Anaconda Powershell Prompt and select “Run as Administrator”) so the changes take effect. Remember that after reopeing the command line you need to run againconda activate benchmark.For Linux: Depending on your distribution, different instructions for installation of R 4.0.3 are available at https://docs.rstudio.com/resources/install-r/. Just make sure you select v4.0.3, instead of 3.6, which is the default suggested by these instructions.
Hint
For instance, if you use Ubuntu 20.04, you need to run the following commands to install Rv4.0:
sudo apt-key adv --keyserver keyserver.ubuntu.com \
    --recv-keys E298A3A825C0D65DFD57CBB651716619E084DAB9
sudo add-apt-repository \
    'deb https://cloud.r-project.org/bin/linux/ubuntu focal-cran40/'
sudo apt-get update
sudo apt-get -y install r-base libxml2-dev
Make sure that the Rscript command can be called from the command line (or Anaconda Powershell Prompt in Windows) by running the following command and checking that the correct version is shown:
Rscript --version
Step 2.2 Install R packages
This step installs the apollo, mlogit, mixl, and gmnl R packages. In your command line (or Anaconda Powershell Prompt in windows) navigate to the location of the provided benchmark folder using the cd (change directory) command (e.g. cd C:\User\xlogit\benchmark) and then execute the command below. This command may require Administrator permissions so if you are in Windows Run the Anaconda Powershell Prompt as Administrator or if you are in Linux run this command as sudo:
Rscript requirements_r.R
Step 3. Run the mini benchmark
First, navigate to the location of the provided benchmark folder using the cd (change directory) command (e.g. cd C:\User\xlogit\benchmark). Second, make sure that all the dependencies were properly installed by running the following command, which should show a successful configuration for all the packages and no errors:
python check_environment.py
Finally, run the benchmark using the following command:
python benchmark.py mini
During the execution in Microsoft Windows, the Anaconda Powershell Prompt sometimes gets stuck and stops showing the output. In this case, just press Enter every once in a while and the output will be shown again. Also, sometimes you may think the benchmark has frozen as it does not show any output for a long time; however, this is not an issue as the estimation processes are still running in the background. This is caused by the slow estimation time that some packages have. At the end of the execution, the figures and output are saved in the “benchmark/results” folder. The file benchmark_results.out contains the information used to create the tables and figures in the paper as follows:
The section titled “PYLOGIT AND MLOGIT BENCHMARK” contains all results for Figure 1.
The section titled “ESTIMATES (COEFF AND STD.ERR.)” contains the results for Table 1 and Table 2.
The section titled “APOLLO AND BIOGEME BENCHMARK” contains the results for Figure 2.
The section titled “TABLE COMPARISON ESTIMATION TIME” contains the results for Table 3.
Warning
The descriptions in the benchmark scripts and output files do not include the packages mixl and gmnl given that these packages were added last as additional comparison packages.
The usage example in Section 3.3 of the paper is not part of the output file but it can be found in the Google Colab file https://colab.research.google.com/github/arteagac/xlogit/blob/master/examples/benchmark/google_colab_benchmark.ipynb in the section titled “Part 5: Fishing dataset usage example”
Option 3: Full benchmark
This is the full version of the benchmark replication, which should take from 12 to 24 hours to run. A very powerful computer is needed for this benchmark as it evaluates the performance of apollo and biogeme using up to 64 processor cores.
Hint
(OPTIONAL) Docker image available: Similar to the mini benchmark, if you have a Linux machine, the easiest way to run the full benchmark is using the Docker image arteagac/xlogit:benchmark in Docker’s Hub. You just need to install Docker and run the following command (note that this command is different to the one for the mini benchmark):
docker run --gpus all arteagac/xlogit:benchmark python -u benchmark.py
After running the benchmkark, the results (including the plots) are saved in the xlogit/examples/benchmark/results folder inside the docker container, which can be extracted using:
docker cp <container_id>:xlogit/examples/benchmark/results .
To identify your container id, you need to run docker ps -a. The Dockerfile used to create the xlogit-benchmark image can be found in the provided benchmark folder.
3.1 Requirements
A CUDA-enabled NVIDIA Graphics Card
Windows 10 or Linux Operating System
Processor with at least with 64 Cores (for apollo and biogeme)
3.2 Installation steps
Follow the same steps as in the mini-benchmark (section 2.2) to install all the dependencies. The only difference is the final command to execute the benchmark that must be in this case:
python benchmark.py
At the end of the execution, the figures and output are saved in the “benchmark/results” folder. The file benchmark_results.out contains the information used to create the tables and figures in the paper as follows:
The section titled “PYLOGIT AND MLOGIT BENCHMARK” contains all results for Figure 1.
The section titled “ESTIMATES (COEFF AND STD.ERR.)” contains the results for Table 1 and Table 2.
The section titled “APOLLO AND BIOGEME BENCHMARK” contains the results for Figure 2.
The section titled “TABLE COMPARISON ESTIMATION TIME” contains the results for Table 3.